
These days, people are using apps for everything from tracking their weight loss goals to stock trading. Even though using such apps makes your job much more relaxed, it gathers a lot of our personal information, which is not secure. If you wish to monitor some specific stocks for investing in them, it is always not a safe solution to get apps. Instead, you can easily create your stock tracker on Google Sheets, even if you don’t have any coding experience.
Let us find out how to use Google Sheets as a stock tracker for free.
Content
- How to Create a Basic Google Sheet Stock Tracker?
- Create an Advanced Stock Tracker with Google Sheets
- Find Historical Stock Price Data on Google Sheets
- Create Stocks Chart Graph on Google Sheets
How to Create a Basic Google Sheet Stock Tracker?
Google Finance lets you see share price and stock market trends. Google integrates Google Finance with the Google Sheets with the function GOOGLEFINANCE. Today, we are going to use this function to create a Google Sheet stock tracker.
Let’s assume that you would like to watch, say, 10-20 stocks for a couple of months before investing. Now, let’s see how to create a basic stock portfolio tracker on Google Sheets.

- First, create a new sheet by navigating to sheets.google.com.
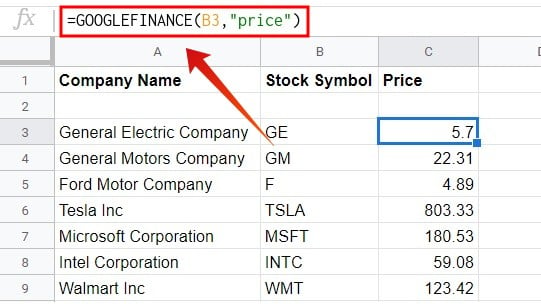
- Next, add columns: Company Name, Stock symbol, Price.
- Then, add the company names and their symbols on the respective columns. You can search on Google to get their symbols.
- Click on the cell under the Price column, against the first record.
- Click on the text field next to “fx” and type the following formula:
=GOOGLEFINANCE(ticker, "price"). - For example,
=GOOGLEFINANCE(MSFT, "price"). - Hit Enter.
You can now see the current stock price of the company you listed.
In this example, column B lists the stock symbols. So, if you type the following formula =GOOGLEFINANCE(B3, “price”) on cell C3, it will be populated with the current price of the stock on B3. Then, you can drag that cell to other rows on column C to get stock prices of all other stocks as well.
Once you add stock details, you can share the sheets with others as well. It is also possible to share specific tabs in Google Sheets without sharing the entire spreadsheet file.
Find Historical Stock Price Data on Google Sheets
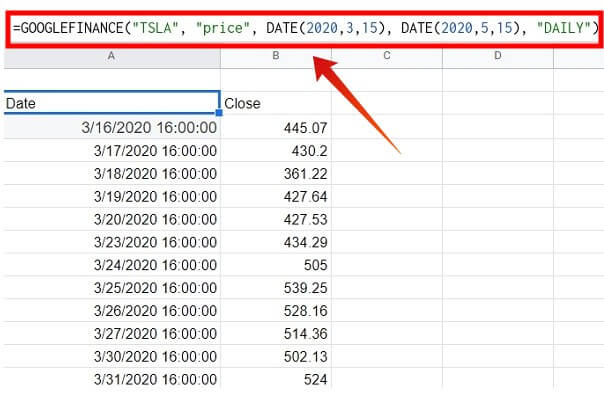
So far, we have just retrieved stock data using the built-in formulas. Now, let’s try to create a custom formula. For example, let’s say you would like to analyze the performance of a stock over a period of time. You can use a custom Google Finance formula to find and analyze historical stock price data on Google Sheets.
=GOOGLEFINANCE(ticker, "price", start-date, end-date, "DAILY")
For example, let’s say you would like to analyze the performance of Tesla Inc (TSLA) stock in the last 60 days. To get that data, let’s customize the formula.
=GOOGLEFINANCE("TSLA", "price", DATE(2020,3,15), DATE(2020,5,15), "DAILY")

Related: 8 Best Google Sheets Add-ons to Improve Productivity.
Create Stocks Chart Graph on Google Sheets
Apart from the table data, you can also convert the historical data into easily understandable graphs and bars. When it comes to stock trading, showing data in the graph makes more sense. Here is how to convert Google Sheets table data into a graph or pie chart.
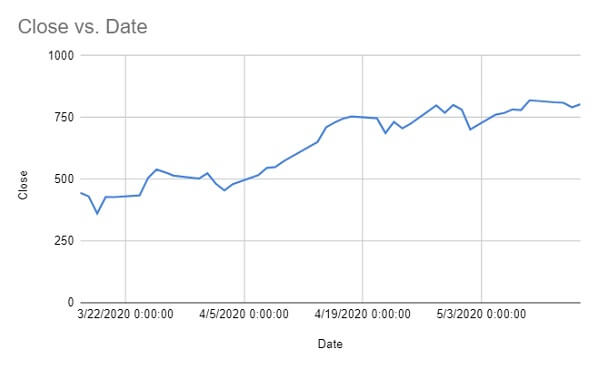

- Select all data you want to make a graph chart from.
- Click Insert > Chart from the menu bar.
- Resize and move the graph on Google Sheets.
You can play with the options to change the graph type, adjust the date range, or do anything you wish. In case you do not want to use Google Sheets to track your stock portfolio, there are plenty of Stock tracker apps available for Android and iPhone.
Create Advanced Stock Tracker with Google Sheets
Do you need to make an in-depth analysis of the stocks? Fortunately, you can extract a lot of information for a specific stock by using the GOOGLEFINANCE function. For example, you can easily fetch important real-time data for a share like trading volume, opening price, 52 weeks high/low price, and more.
To get such advanced data on your stock, you can use extra parameters of GOOGLEFINANCE function. You just need to create additional columns and use the functions as follows,
=GOOGLEFINANCE(ticker, "volume")
=GOOGLEFINANCE(ticker, "priceopen")
=GOOGLEFINANCE(ticker, "high52")
=GOOGLEFINANCE(ticker, "low52")
![]()

Likewise, you can get other information like price-to-earnings ratio (P/E), earnings per share (EPS), and more. There is more you can do with the Google Finance functions to use Google Sheets as a stock tracker.
Enhanced Google Sheets Stock Tracker with Formatting
Well, you can improve the stock tracker’s appearance and formatting with conditional formatting. We’ve extended the capability of the sheet further by adding the column to indicate the time to buy and time to sell each stock. See the following additional formatting we did.
![]()

We set the following indicators based on the simple principle, “Buy on low & Sell on high“.
- Time to sell: Difference between Current Price-52 Week high price.
- Time to buy: Difference between Current Price-52 Week low price.
- Up/Down: Difference between Current Price-Purchase Price.
You can set the Red and Green colors to fill on cells with conditional formating. This can provide you an additional indication where the share value drops near to 52-week low or 52-week high historical value.
Now, you have successfully created your own stock portfolio tracker on Google Sheets. For quick access, just add the sheets to your favorites/bookmarks and track your stocks with a single click anytime you need.
Well, we have shown a simple example of how you can create and use your own Google Sheets stock tracker. You can always add more features based on your requirements to the stock tracker made with Google Sheets.


